Mathematical functions can be viewed from different perspectives: analytical, graphical, and numerical. Each perspective allows us to see functions from different viewpoints.
WeTheStudy lets you connect ideas
Learn more

We can view mathematical functions in three ways: analytical, numerical, and graphical.

To illustrate the differences, let's see how we can express the relationship between the radius \(r\) and area of a circle \(A\) using these approaches:

Analytical

The first viewpoint is analytical. It is when we approach the situation using its mathematical symbols and operations. If we want to look at \(r\)-\(A\) relationship analytically, it is the function by itself: \(A(r)=\pi{r^2}\).

Numerical

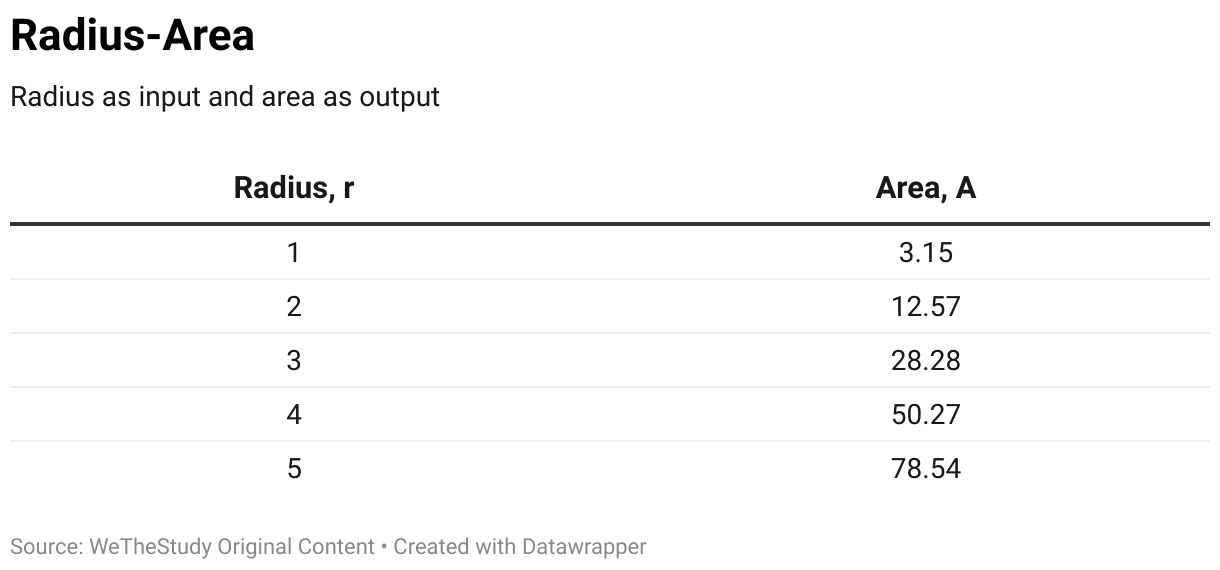
The next one is the numerical viewpoint. In this perspective, we create what we call the table of values. It's a table format of inputs and outputs. To construct one:

  • First, give multiple inputs for the function and place it in one column. In our example, it would be a list of radius (1, 2, 3, etc.) 
  • Next, solve for its corresponding output in an adjacent column (\(\pi\), \(4\pi\), \(9\pi\), etc.) 
  • The resulting table is the table of values.
Want to access the remaining content?
You're a Member!
Click to expand on exclusive content
Want to access the remaining content?

Become a Member

When you sign-up and subscribe to WeTheStudy, you’ll get the following benefits:

No ads! (yey!)
Complete access to all articles
Ability to track your progress in the tree

SIGN-UP

Complete Your Checkout

When you complete your account, here are the following benefits:

No ads! (yey!)
Complete access to all articles
Ability to track your progress in the tree

PROCEED CHECKOUT

Graphical

Graphical Perspective

The final approach is the graphical viewpoint. It uses a plot between the inputs and outputs of a function. 

To illustrate this perspective, let's use a Cartesian grid and plot our example:

  • Let the x-axis be the input of the function. In our example, it would be the radius.
  • Let the y-axis be the output, which is the area of the circle.
  • We plot each input-output pair and draw a line through the points.

Why These Approaches?

Considering functions from different perspectives helps us understand the relationship between sets. For example,

  • We use the analytical perspective to understand the relationship between groups logically.
  • We use the numerical and graphical view to find certain relationships or patterns among values. If we have a set of values, we can see if it will follow a linear, parabolic, or cyclic pattern.
  • We use the graphical approach to see a visual image of our function.

Summary

We can view and analyze mathematical functions in three ways: analytical, numerical, and graphical.
The analytical viewpoint is approaching the situation using its mathematical symbols and operations.
The numerical viewpoint makes use of the table of values.
The graphical viewpoint uses a plot between the inputs and outputs.

Created On
June 5, 2023
Updated On
February 23, 2024
Contributors
Edgar Christian Dirige
Founder
References

WeTheStudy original content

Revision
1.00
Got some questions? Something wrong? Contact us