
Problems in differential equations (DE) are typically finding a solution to the said DE. We can approach it in three ways:
This post will show how to graph DEs and find an approximate solution. To solve for DEs graphically, we plot them.
Plotting Differential Equations
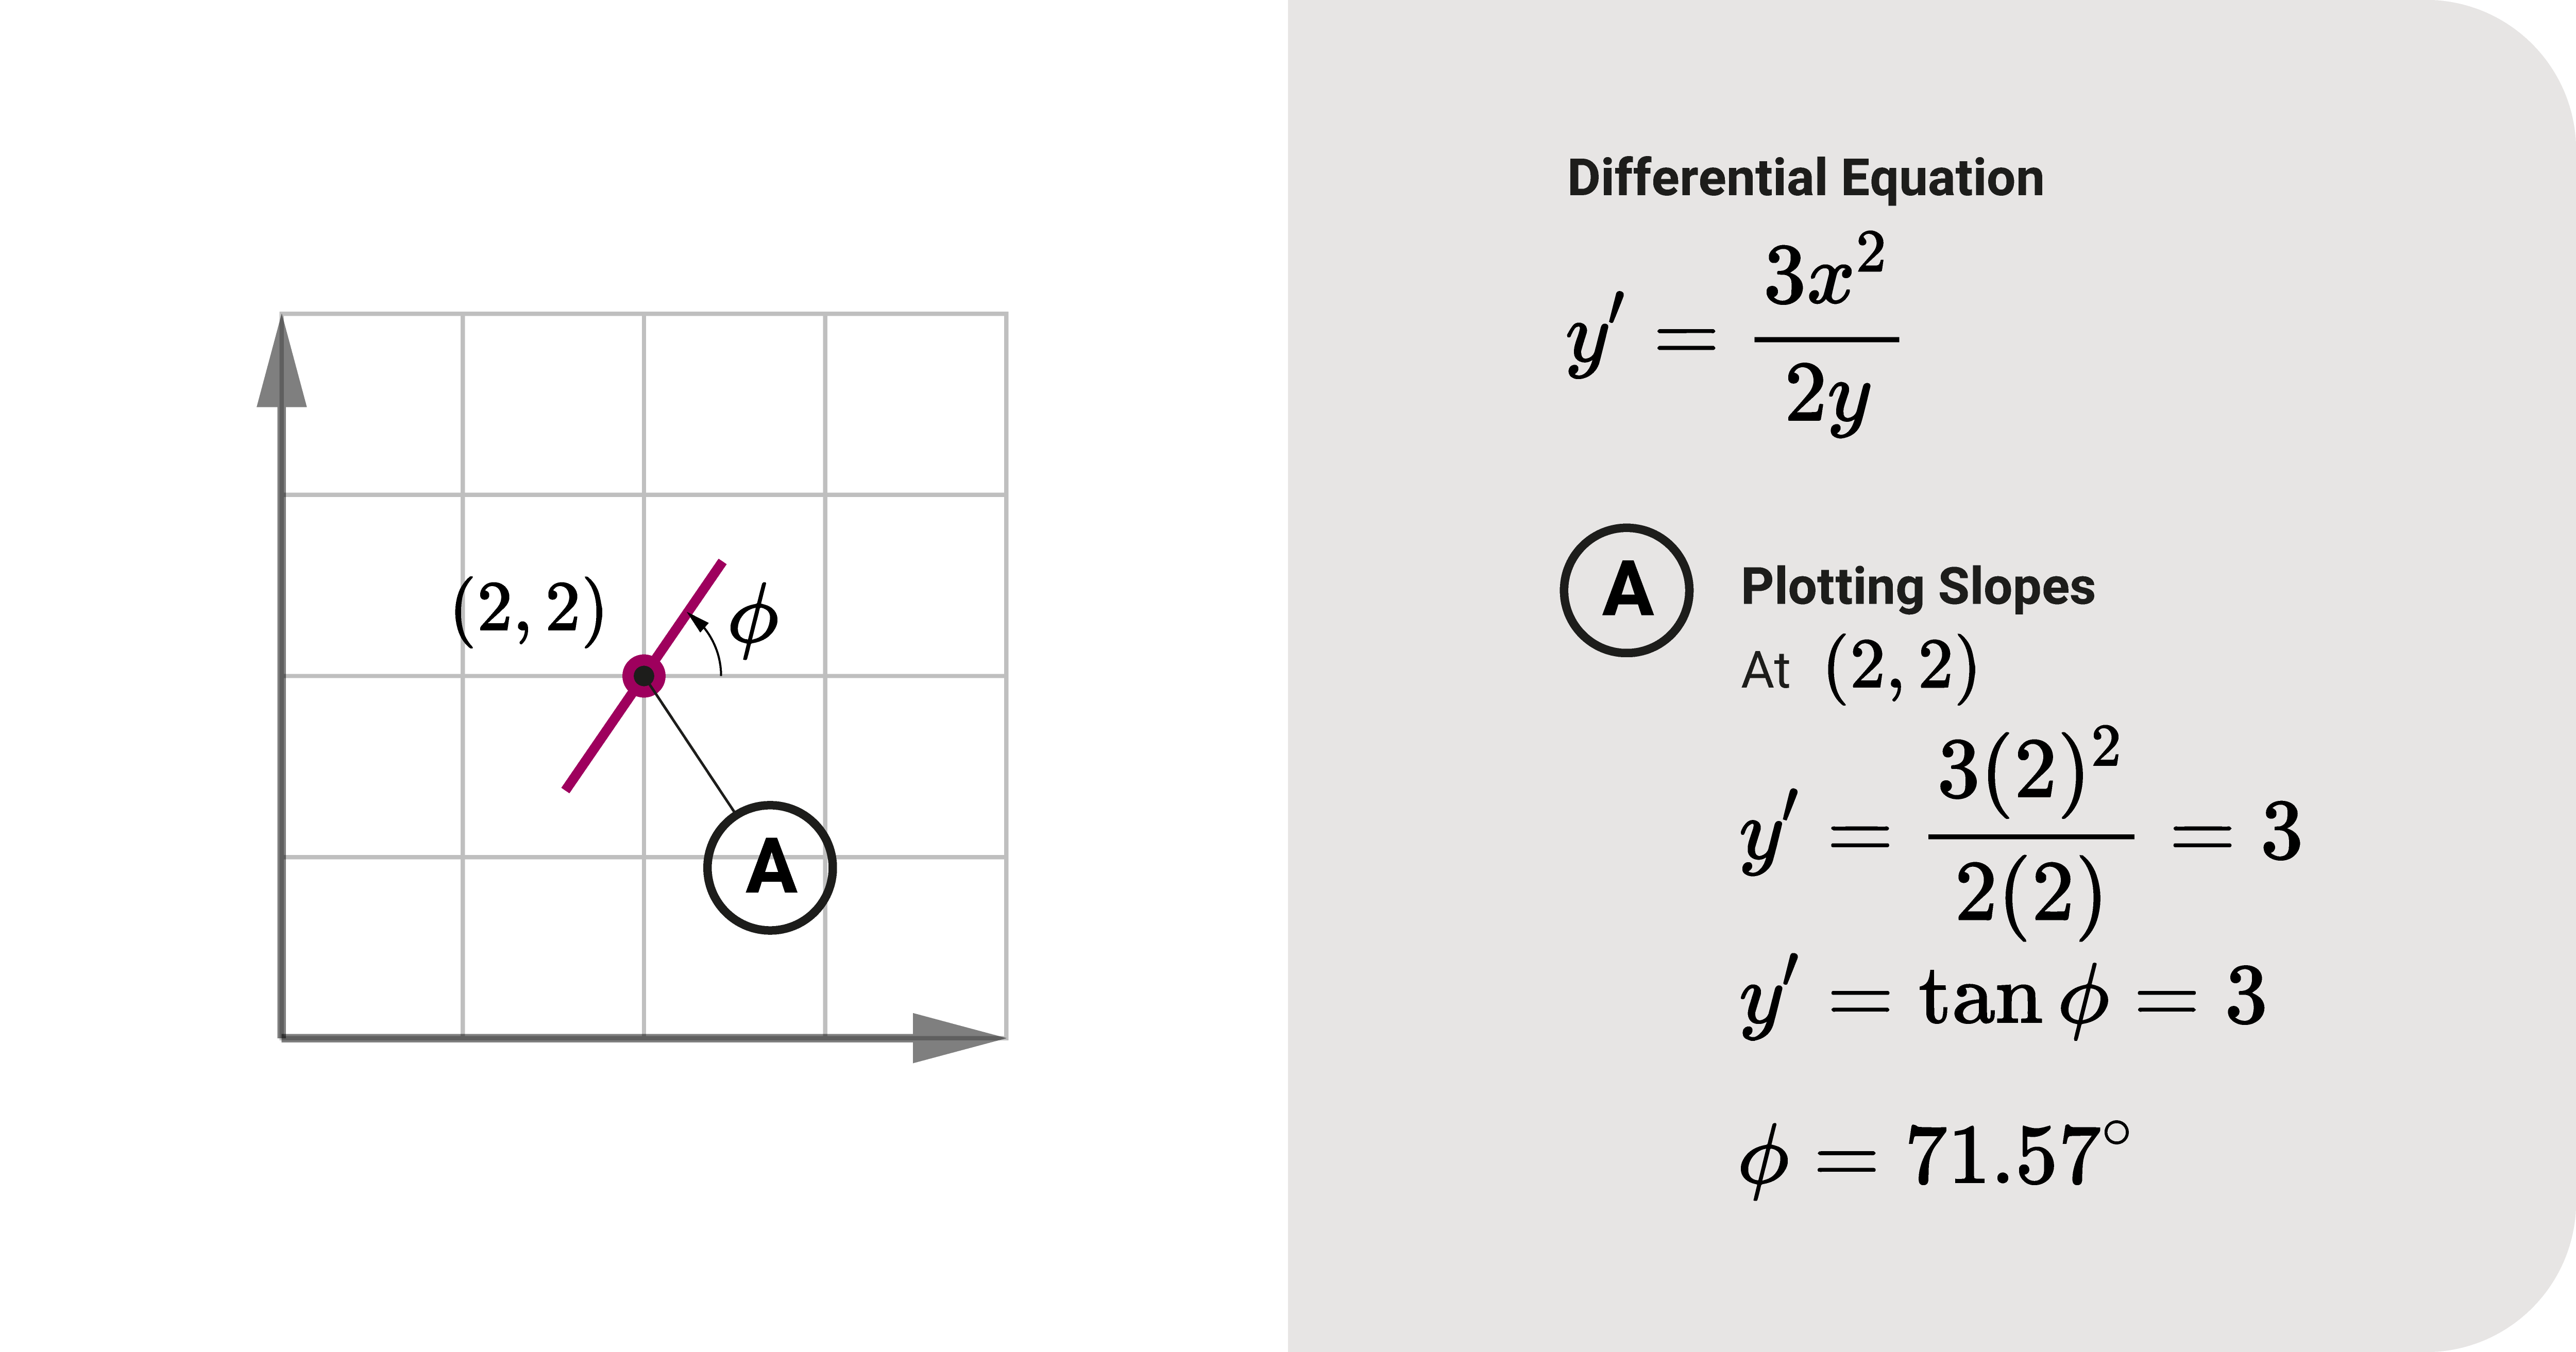
Consider a differential equation of the form \(y^\prime = F(x,y)\) – the first derivative is a function of \(x\) and \(y\). Let's consider an example, \(y^\prime = \frac{3x^2}{2y}\).
To graph a differential equation, first, solve for \(y^\prime\) using multiple different points.
- For coordinate \((1,1)\), \(y^\prime\) is 1.5. In angle units, that equals to \(56.31^{\circ}\).
- For coordinate \((2,2)\), \(y^\prime\) is 3. In angle units, that equals to \(71.57^{\circ}\).
We are now ready to plot with \(y^\prime\) solved for specific coordinate points. Remember that \(y^\prime\) or the first derivative means the slope. So, when plotting, we will be drawing the slope lines at specific points:
- At \((1,1)\), we create a slope line with an angle of \(56.31^{\circ}\)
- At \((2,2)\), we make a slope line with an angle of \(71.57^{\circ}\)
Slope Fields
Now that we know how to plot slopes, we can discuss the slope field. It's a plot of the slopes of the differential equation. It's helpful if we want a visual of the differential equation.
To create one, we consider a lot of coordinates over a region and plot the slopes. Below is a slope field of our DE example \(y^\prime = \frac{3x^2}{2y}\):
From this graph, we can observe a pattern from the angle of the slopes. These slopes act as tangent lines to the general solution curves of the differential equation.
Summary
We can approximate the general solution curves of a differential equation using graphical means.
To solve differential equations graphically, we plot them.
To graph a differential equation, first, solve for \(y^\prime\) using multiple different coordinates. Then, we plot \(y^\prime\) using slope lines.
A plot of the slopes of the differential equation is a slope field. It's helpful if we want a visual of the differential equation.
We can observe patterns when studying slope fields. These slopes act as tangent lines to the general solution curves of the differential equation.


